Help

Here you will find a detailed and updated manual for Kampal. If you want to check out a quick guide, you can do so here. If you prefer to see which information Kampal stores about myself and my environment click here.

Index

Application description

Kampal Research (KR) is a tool developed and commercialized by Kampal Data Solutions for the analysis of R&D Institutions. Therefore, all available data from corporative and third party databases is downloaded. Then, their structure is analyzed and visualized using statistics and complex systems techniques, plotting the results in terms of numbers and graphs. This way we obtain a reliable representation of the institutions and groups that form it, along with individual researchers, and relevant information for decision making in short, medium and large term to improve it.

Data is the keystone of the tool, which can be divided in three categories:

  • Data about the institution personnel
  • Organizational structure (Divisions, Centers, Departments...)
  • Data relative to the activity from the Institution: Publications, Projects, Thesis, Patents, etc.

With them, a deep analysis about the Institution is made, providing among others:

  • Statistical analysis of its activity
  • Relational maps construction
  • Communities identification
  • Strong and weak spots in the collaborative structure
  • Prominent or peripheral researchers
  • Evolution over time of the activity
  • Identification of new opportunities or shrinking activities
  • Individual reports
  • Reports on departments, centers, different groups...

Different institutions have different categories and classifications. Kampal adapts to these features analyzing all available data, varying with each institution. An institution might have its patents registered, or the Erasmus’ trips of its students, when another one might not. This is why everything reflected in this manual might not correspond to a particular institution.

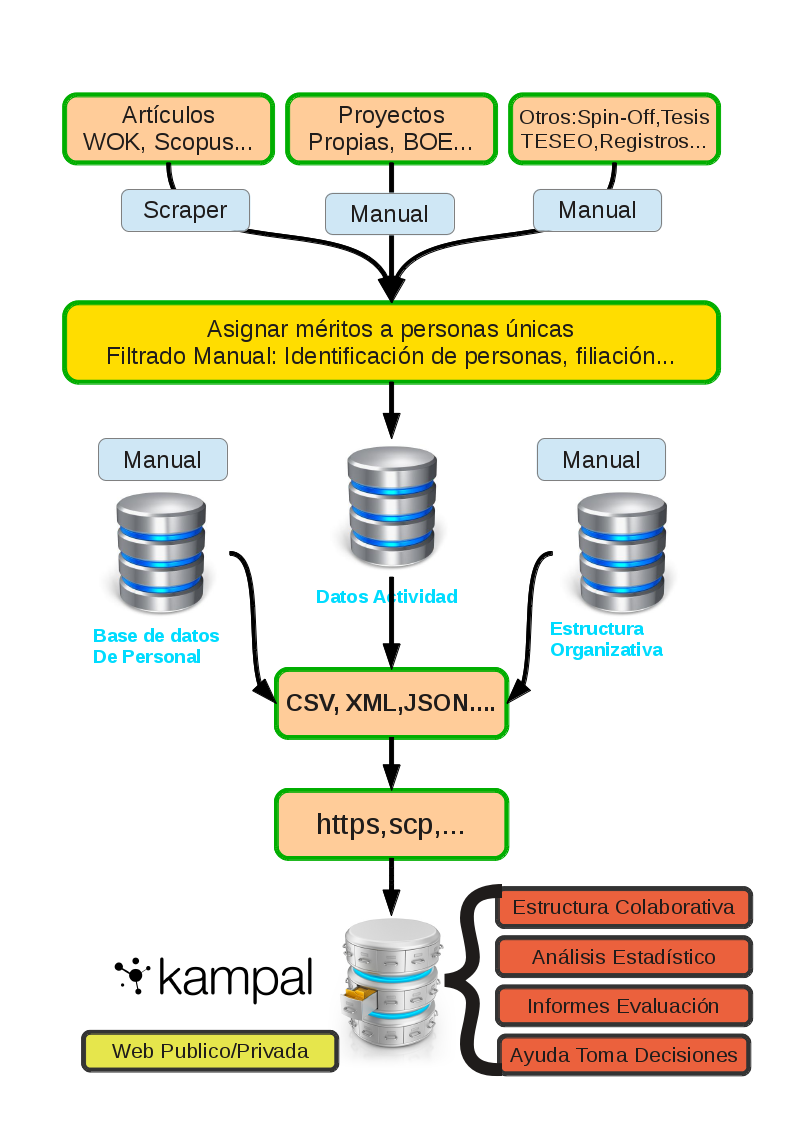
In the following figure we can see a global schema of the data and information flow at Kampal Research.

Application access

The application can be accessed through https://www.kampal.com, where there is a link to https://research.kampal.com. There, public projects can be seen. If you have an account all public and private projects associated with that account can be accessed.

Projects

At Kampal Research (KR) each basic unit of analysis, the project generally corresponding to an institution, can be configured as public or private. If public, it will be accessible by any guest to the site, if private, only users with username and password will be able to access it. In any other situation, other access control systems can be used, such as IP filtering.

Projects configuration

Projects can be configured by their owner (superuser, there can be several). For this, once logged in, he can access the administration project menu clicking in the project icon. The available functionalities are:

  • Pick an image. It will be shown when accessing the project.
  • Set public/private. If it is declared public, anyone will be able to visualize and browse through the project (without configuration access). If it is private, it will be only accesible if the user has an account
  • Create a user. The project superuser can create here, if the project is public, any number of users, assigning them a default password. Only in private projects. These users can't access the configuration menu.
  • Description. A brief descriptive text of the project that will be shown as Info.
  • Institutional presentation. In the access icon to the institution, a PDF with any information uploaded by the superuser can be accessed.

Projects access

Through public projects or my projects (if logged in) you can access the corresponding projects.

A project list with a brief summary of each one of them can be seen.

To access a single project, click on its image; if it’s public it can be accessed directly; if private, it will ask for a user and password if not logged in with an authorized user. To follow this manual, it is recommended to follow it using the application. If you don't have an authorized account, the Demo institution, ficticious and public, can be used.

Interface

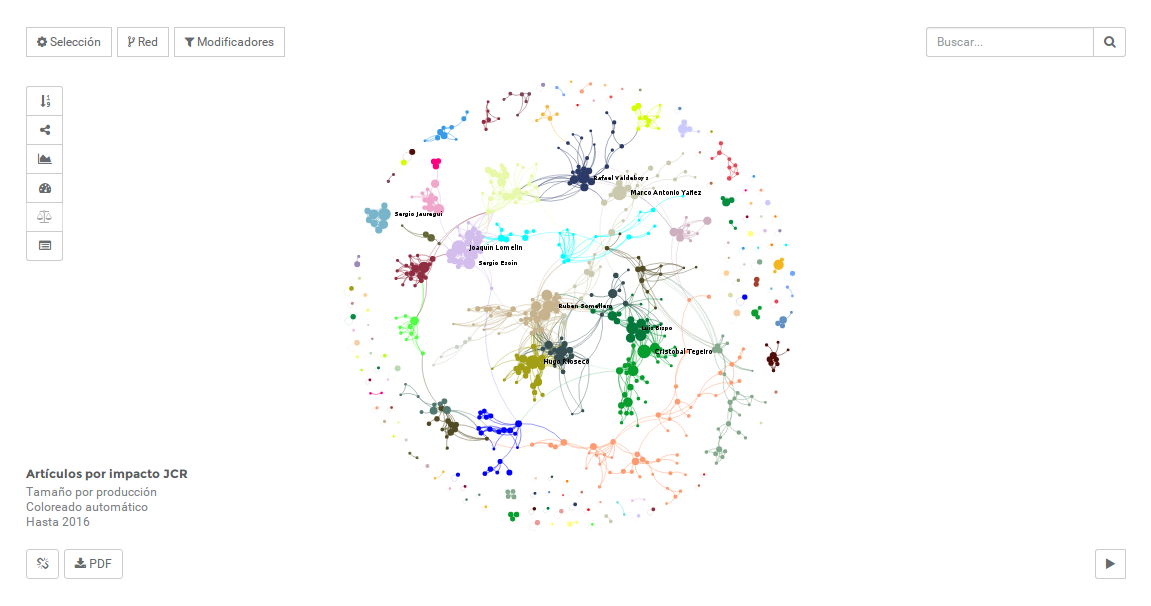
When project is accessed, the system loads the default view after a few seconds, which is the full system (all the researchers in the institution) with some parameters set to default values. The view is similar to the following one

The full analysis consists of a wide set of results, accessible through the selection of several options and parameters. Everything can be seen and modified with this interface.

  • Viewer. Central Graphic Area It’s where you can see the analysis results, in graphic or numeric mode. In this case a typical graph is shown
  • Analysis. Top left area, horizontal buttons Here’s where the set of researchers is specified, which data is going to be analyzed and how the collaborations between them are defined. That is to say, we specify people (nodes) and the relations to study (links).
    • Selection
    • Network
    • Modifiers
  • Data to show in the viewer Top left area, vertical buttons
    • Production
    • Communities
    • Evolution
    • Network properties
    • Selection evaluation
    • Merits list
  • Current view description Bottom left area
  • Other options
    • Link visibility and PDF/JPG generation bottom left area
    • Search Top right area
    • Animation Bottom right area

Each section will be described in detail next.

Viewer

It’s in the middle, where all study’s results are shown.

Inside the viewer we can choose multiple parameters and options, as well as the posibility of downloading a PDF, switch to full screen, or see an animation with the activity evolution.

By default the collaborative map is displayed, making it possible to see groups and communities, interactions, role or relevance of each subset or researcher in particular. It gives information about the robustness and intensity of the collaborations and the role played by different communities and people.

Nodes (researchers) can be seen as colored circles of different sizes and links (relations), which also have colors and variable thickness.

In the bottom left area we can see a description of the fundamental parameters of the current analysis, for example:

Publications indexed by impact, size by production, automatic coloring, until 2015

For different choices, even with the same researchers, changing the links’ weight or the kind of data used we’ll get completely different maps, each of them with different relevant information for each activity.

Navigation in the viewer

Using the viewer we can zoom in and out using the wheel mouse, and we can browse around the map clicking and dragging over it (the links are removed while doing this to improve performance). We can perform searches of nodes in the map inside the internal search bar top right area.

Node information

Clicking on one node basic information about it can be seen:

  • Name and ascriptions to different structures such as department, faculty, institutes, etc.
  • Report on the researcher’s activity, both in absolute terms and comparatively with the institution. Since it contains a great amount of information and some ideas haven’t been introduced yet, it’ll be explained later See Individual Report
  • Achievement list of the researcher
  • Link to a PDF file which may contain a CV (in full detail or summarized), a summary of his research, etc.
  • Collaborative path between researchers: in the dropdown on each researcher Go from and Go to can be seen. Clicking on a node in Go from makes it so that the node is being selected; we can now click on another one in Go to to calculate the shortest path between them, travelling always on existing links (collaborations). This way we can know how far or close two people are collaboratively, or how to get from one to the other travelling through people they know.
  • Reseacher picture
  • Link to a website (for example a user’s personal website or his Facebook page…)
  • Link to a PDF file which may contain a CV (in full detail or summarized), a summary of his research, etc.

The information on this dropdown (pictures, attachments, files…) will only be accessible when data is available on the server and when authorized.

Additional actions

In the bottom area three additional actions can be performed:

  • See links (on/off)
  • Ask for the generation of a graphic file, be it PDF or JPG, with the displayed map at that moment; the file has information and logos properly tagged. It can be chosen to download it with or without names and logos of the researcher in each circle
  • See an animation with the selected group’s activity evolution

The information on this dropdown (pictures, attachments, files…) will only be accessible when data is available on the server and when authorized.

In the upper right area there is a search bar to find people in the current map.

Selection

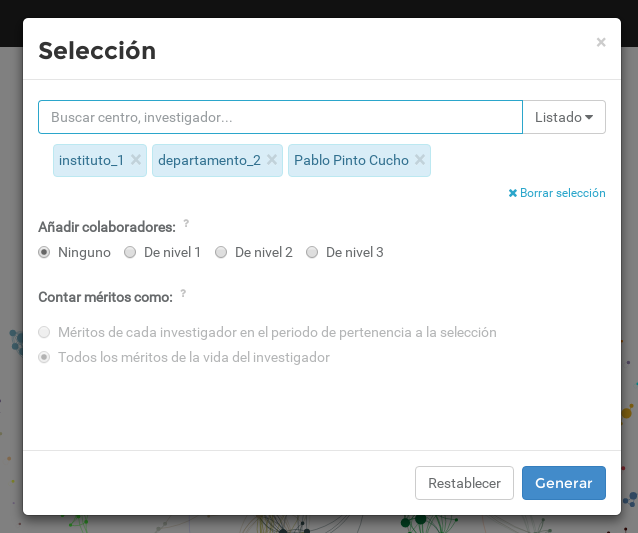
From here, we can select the set of researchers to analyze. It is possible to use a wide variety of options for the selection.

  • Select by name
  • Select each of the organizative structures
  • A set of people
  • A mix everything above
Merits modifier

This option will only be active when we select an ascription, (e.g. a department). It displays if the merits have to be counted in total or only those generated while the researcher has been ascribed.

Let’s look at an example. An institution was founded in 1990. A department was founded in 2000, and has 20 members now. 10 of them have been on the institution since 1990, but were a part of another department before 2000; 6 of them joined the department in 2004, but they were part of the institution since 1995, and 4 of them joined the institution and the department in 2000, but left in 2008. Of these 4, 2 left the institution altogether.

If we choose the department on the selection, and the option to count merits only in the ascription period, of the 10 permanent researchers, we’ll count all of their achievements since 2000 until now. From the next 6, merits generated between 2004 and present day. And finally from the last 4, achievements generated between 2000 and 2008.

However, if we choose all merits from the researcher, all of them will be counted while he has been part of the institution; that is, from the first 10 researchers, merits between 1990 and now, from the next 6, the ones between 1995 and now, and from the last 4, those that left the institution in 2008 will have theirs from 2000 until 2008 counted and those who didn’t will have theirs counted from 2000 until 2008.

Analysis period

Here’s where the period in which merits are considered for the chosen selection is picked. By default it’s everything, which corresponds to the date of the first achievement until now.

When last period is chosen, the system proceeds in the following manner: on project creation, departments, institutes, etc of the institution are created. For each one of these, a yearly period is given, corresponding to the standard of external evaluations, or just that of a period to see the merits in a given period. For example, let’s suppose that for a given department 5 years are given, from the start of 2010 until the end of 2014, and the next one from 2015 until 2019. If we choose last period, the system will analyze the last full period, that is, from 2010 until 2014.

If we want to choose a specific date range, Ad Hoc has to be chosen.

The user indicates what he desires and the system autocompletes searching among all the names and surnames of the researchers. It also takes into account the names of all organizative structures (departments, institutes, etc.).

Footnote: In this bar, the system searches from the whole available database; this bar can’t be confused with the viewer search bar top rightmost area, which only searches from the available researcher names in the current map in the viewer.

Multiple searches

Once the search has finished, it remains in the selector. We can add as many selections as we want, and they will be joined adding all the researchers among them.

Remove selection

It allows the removal of all selections, which can also be removed individually clicking on the cross of each field.

List

Here you can view any of the organizations that form the institution.

First, the different types of structures are displayed (departments, faculties,...), and inside each type, a full list of the specific structure. You can select one by one or all at once.

Adding co-investigators

  • No. Strictly all the selected researchers. By default.
  • Level 1. Let's consider level 1 co-investigators those researchers who have collaborated with at least one researcher of the selected subset. That is to say, given a selected subset, level 1 is composed of every researcher that belongs to this subset and those who have a link with them.
  • Level 2. Let's consider the chosen researchers and the level 1 researchers. Then, we add all of their co-investigators, that is the original set, those who have a link with them, and those who have a link with the previous ones.
  • Level 3. Let's consider the chosen researchers, the level 1 researchers, the level 2 researchers, and the level 3 researchers and add all of their co-investigators.

It’s important to note that the number of people grows proportionally to the level.

Reset

Once the study has been generated, the parameters that are being displayed appear on this line. These parameters correspond to the last view generated, not necessarily the defect. Clicking on Recharge in this line, you go to the view with all the default options.

Generate

Clicking here all calculations and real-time analysis is performed. After the calculation, the results are loaded and shown according to the selected parameters at that time that appear in the viewer. Note that if we changed the set of researchers, and before pressing Generate we change go back to the viewer, it stays with the original selection, without modifying anything.

Network

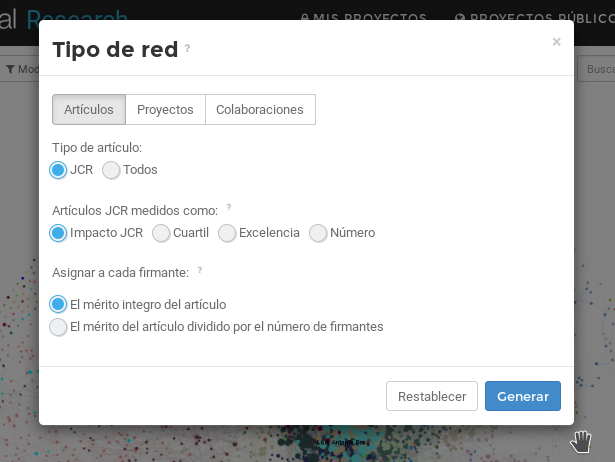
Here we determine the type of data to be analyzed, the kind of relationships we want to study and the weight we want to give to their relationships to build collaborative networks. For example, if we want to study the activity in scientific publications, we’ll choose Publications, and in it, if we want to weigh the relations according to the impact of the indexed journal, we select Indexed.

Each choice is used to analyze different aspects of the system, to have different points of view. Of course it is possible to do studies where different activities are integrated, if we want to have an overview of the system.

Kampal allows the analysis of all registered publications in the institution. When publications have been published in indexed journals, specific analysis can be performed with criteria derived from their impact or relative position (quartiles, deciles ...). To analyze these publications we must select Indexed in Publication Type. If we want to do an analysis of all the registered publications in the Institution, whether or not indexed, we must select All in Publication Type. In this case there are no additional quality criteria, weighing the items all the same.

Let's discuss all the different options

Publications

Once the set of people in the selector has been set, the study will be based on the same publications that appear on the project database where we can find at least one of the selected authors. All studies will be conducted based on the chosen aspect (Impact, Excellence...).

Publications’ weight

If we choose the criterion All, we consider the totality of the publications registered in the Institution. In this case we do not consider options to weigh the quality of the publications, all considered equal, basing the analysis on their total number.

If the Indexed criterion is chosen, then publications published in indexed journals are analyzed.

To quantify the analysis several criteria can be set

  • Indexed. Each publication is weighted according to its Impact Factor. It is the simplest way to assign a weight to publications to measure their quality.
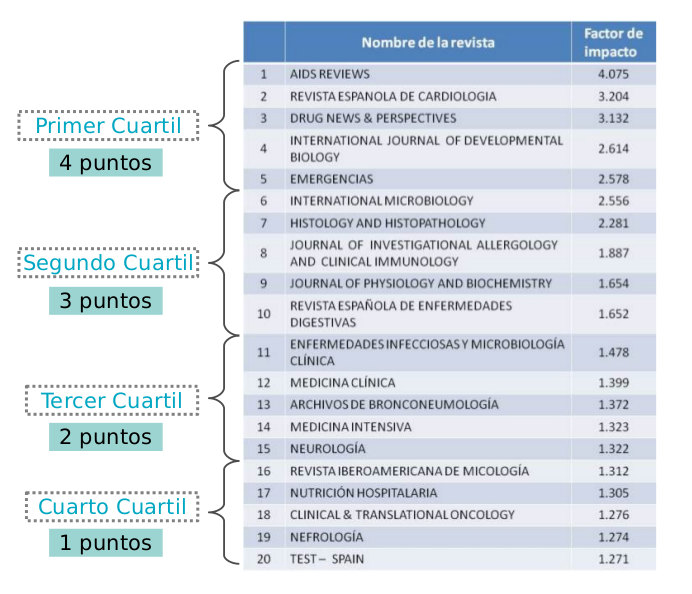
  • Quartile. The quartile of the publication is estimated in the corresponding year, assigning it 4 points if it is in the first quartile (Q1), 3 if it is in the second (Q2), 2 in the third (Q3), and 1 if in the fourth (Q4) one. Quartiles (or percentiles in general) are often used by organizations and rating agencies worldwide.
  • Excellence. For the study we only consider those publications that are in the first decile, with the same weight of 1 for all of them. The rest are not considered. It allows us to analyze the excellence.
  • Number. All publications weigh the same. We select 1. It allows us to analyze the production by number. Note that with this option only indexed ones will be used.
  • Citations. All publications weigh the same as its number of citations.

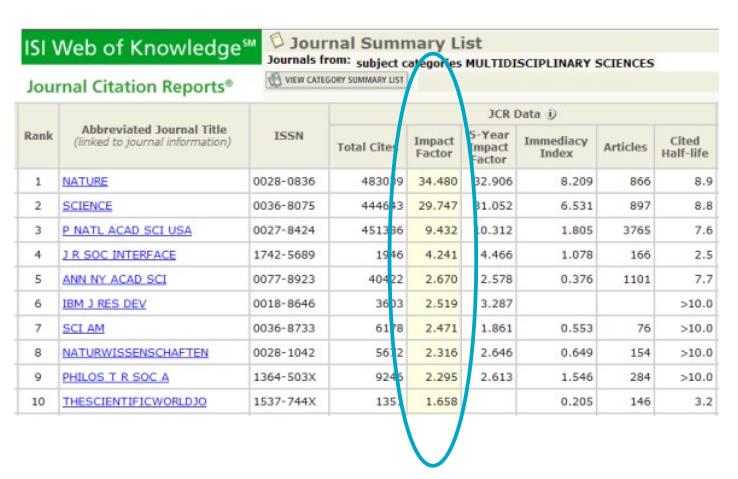
For each publication we use the impact factor of the journal of publication, according to the Journal of Citations Report (Indexados). If there is no data available for a year for a journal, it is assigned the impact of closest year available.

Impact factors

While it is well known, we can briefly recall how impact factors, quartiles, deciles, etc. are set.

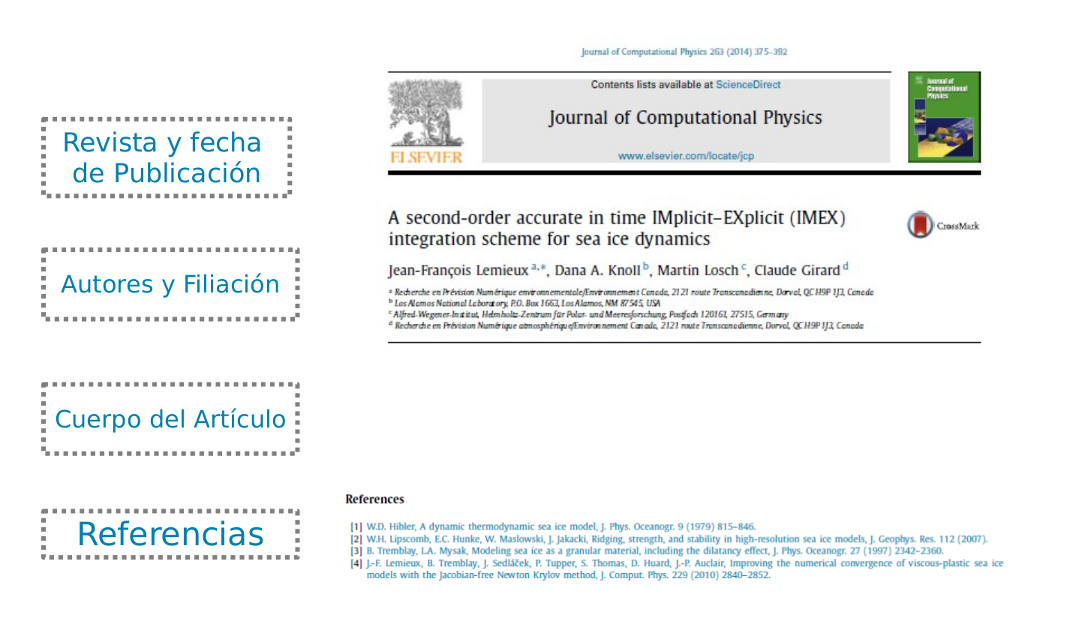
A publication in an indexed journal has several fields, namely:

  • Journal of publication
  • Date
  • Authors and affiliation
  • Body
  • References

There are many publication lists (WOS, Scopus, Scholar Google, archive, Dialnet…), and many impact and quality indices (JCR, SCR…) from Relevant Journals (indexed) stablishing the Impact Factor of each one of them annually, in the following way (simplified).

From a chosen set of journals, its impact and other quality indices can be calculated as follows.

Let's consider the publications published from journal A indexed in 2010. Now we calculate how many citations they have received during the following year. We only account citations from indexed journals. We divide by the total number of publications from journal A in the year 2010, and that’s our impact factor for the journal A in 2010.

Summarizing, the average number of citations that an publication published in that journal generated for two years.

This definition has nuances and some questionable aspects, but it is certainly the most internationally accepted criteria to assess publications. Note that the valuation is therefore based on the journal that published the publication and the particular year, and not to specific aspects of the publication.

Among the many ways to format the quality of publications, the most basic is the previous one. In general, the use of the impact factor has some problems.

The impact factor is applied to all publications in the journal, but it is clear that not all of them have the same impact on the scientific community.

On the other hand there is significant heterogeneity between areas since the number of citations depends on factors unrelated to quality, such as the number of people in the area, types of studies, etc., and they spread to other criteria such as the number of citations from an publication or factors h of researchers.

This comes from the different number of publications and different number of signatures in each scientific area, so that the use of impact factors favors the busiest areas in number of publications, researchers and tendencies to group the signatories in publications.

One way to avoid the problem of different impacts among areas is the use of quartiles, deciles, or other percentiles. Quartiles, for example, are calculated dividing into four the journals of a given scientific area.

Thus, we weight the relative quality of the journal in your area, eliminating the heterogeneity between areas. That is, if the first journal of an area has an impact factor of 20, and the first from another area has 4 (as for example between medicine and mathematics) if we use impact factors researchers working on the first area will be ahead of the ones of the second area. If we use quartiles or percentiles in general, both journals are in the first percentile, and the weight would be the same.

So in general the use of percentiles generates more homogeneous and free of bias comparisons by area of activity.

It doesn’t fix the problem where within the same journal publications of very different quality are published.

Another important factor is the publication’s authors number. There are areas where it is common to divide the merits by the number of authors and other areas where this isn’t done. The problem is again that comparing areas where many publications are signed by hundreds of people to areas where it is usual to find just one or two signatories, where it generates huge heterogeneities.

The number of citations of an article is also relevant to measure its quality. But this metric still has problems, such as self-citations (which do not have the same value) or the difference between citations in different knowledge areas. Also, is not the same to have all citations concentrated in one article as divided into several. This is where the h-index metric comes in.

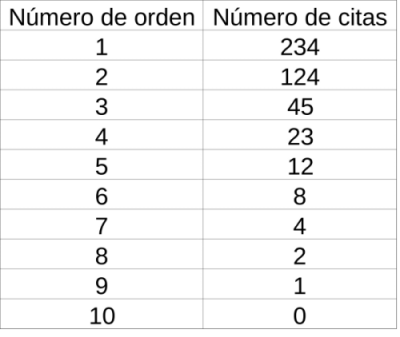
To calculate the h-index we sort a person or institution articles by the number of citations in decreasing order and number them from 1 to N. Now in this list we look for where the Order number cuts the Citations number, that is, the number h of articles that have h or more citations.

In the table above we see that we have 6 articles with 6 or more citations, but we do not have 7 articles with 7 or more citations. Therefore we say that this author's h-index is 6.

All of this is a constant source of study, research, debate, even controversy, and Kampal presents a number of options to cover all the accepted criteria so that in each research area the study can be tailored to its usual criteria.

When studying publications, the collaborative network is set considering that two people are related (they have a link between them) if there are any publications which appear among the signatories.

This way we stablish connections between people. When weighing colaborations, it’s reasonable that a connection produced by a high quality publication attracts signatories more than a low quality one.

To fix this, we must also set the intensity of each of the links in our system. We must also consider that two researchers with 10 publications in common must be alike (attracting more) than two researchers with only 1 in common.

Let's consider a publication signed by four authors, that we have decided to use the impact factor criterion. We assume that there is no hierarchy in the signing of the publications in terms of order, position... Let's take as an example a impact factor of 8 for the journal in which the publication was published. We create a link between all authors so that they all weigh the same, including a link among themselves. We do this so that the sum of each node’s links results in an impact factor of 8 corresponding to the selected publication. According to the graph shown, we assign a weight of 2 to each link, so that each author receives a weight of 8 when adding his links.

If we consider several publications, and we proceed with all of them the same way, we’ll get a set of relationships with links of different weights, such that the sum of all the links on a node gives us the sum of the impact factors of all publications of said person.

We end up this way with links between nodes, each one with a different numerical value, which corresponds exactly to the impact of common publications among these two nodes.

If instead of choosing Indexed quartile is chosen, then it continues in the same way, but the initial weight of the publication is (4,3,2,1) depending on the quartile in which the publication's journal is published.

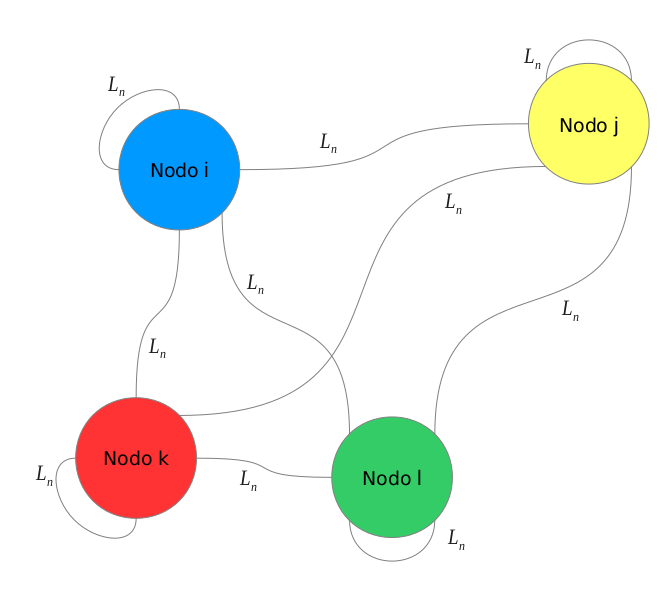
Loops on nodes

They’re links that start and end on the same node.

All researchers with some publication have an autoloop; to avoid overloading graphs, it’s not drawn unless they have a link with someone else; in this case it’s drawn to signal that the researcher has at least one publication.

A circle without loops nor autoloops shows a researcher without production. With Publications, a loop means that the researcher doesn’t have any collaborations with others on the graph, but he has published publications, which can be authored by themselves or others not on the graph.

Allocation of merits and number of signatories

From the above it can be seen that given a publication, with impact factor of 8 with 4 authors, each of them receives a weight of 8 if we use the Indexed option. In some disciplines or evaluation processes, the number of authors is taken into consideration, promoting publications with a lower number of signatories, so we could choose to share the factor of 8 among the 4 authors, assigning 2 to everyone of them. This is specially crucial when we have publications with around 1000 signatories, in which case if the impact factor is 5, 1000 persons receive that merit, which in some disciplines is accepted but not in others, since it's considered that the work required to write a publication among 1000 people is not the same than among 2. In fact, the publication with impact 5 signed by 1000 people, shares merits (valid for everyone’s CV) with a value of 5000 units, while another with the same impact signed by 2, only shares 10. There’s great controversy around this, some defend that a publication with 1000 signatories is complex and the 1000 of them have worked, making the total work gigantic, and those who defend that the signature of some of those 1000 people corresponds to technological or political criteria and not to relevant scientific contributions. In any case, Kampal supports both options.

The The whole merit of each publication option assigns to each signatory the complete merit of the publication. This is the default option.

To choose the option to distribute the impact among the authors (that is applied to indexed, quartile, excellence and number) just select The merit of the publication divided by number of authors. This way, in the example, the 8 impact is distributed homogeneously among the authors, 2 for each one.

Impact factors

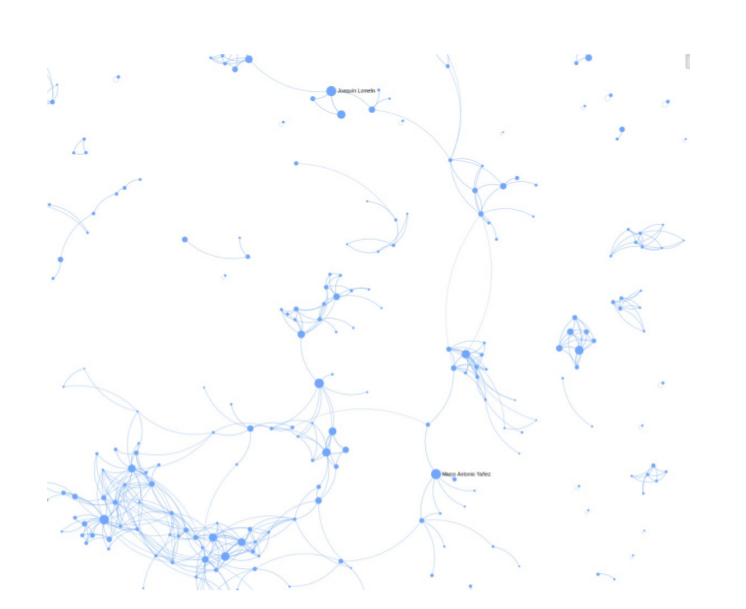
Chosen some data, such as publication, and a specific weight, for example Indexed, we have well defined relationships between the nodes and their intensity. Relationships are represented by links, and their thickness is proportional to the strength of the relationship.

Then we assign positions to each node, so that those who are more attracted to each other than with the rest, occupy close positions. This is not generally simple because the relationships are complex, they are not fixed, and you have to decide where to place each one, knowing that it is impossible to be close to all collaborators. There will be some who will be away, because they have intense collaborations with other groups.

The analogy of a galaxy can be used, where stars are attracted to each other, but clusters are formed in regions of higher density, and these clusters differ from those around them.

This ends up in a situation in which more compact groups are formed, where internal collaboration is more intense, attached to the remainder by certain connections but weaker than internal ones.

Thus we can see at first glance the structure of collaborations of the selected researchers.

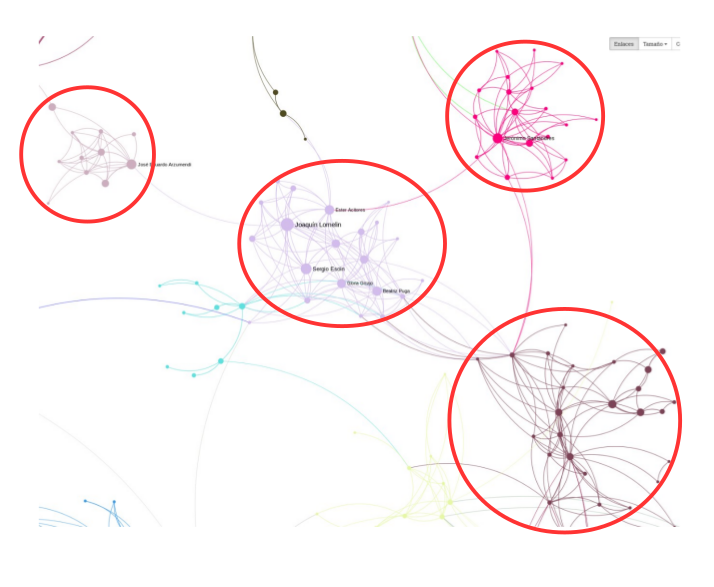
The previous map gives us an idea of who works more often with one another, but nonetheless this is not accurate enough because there are many people "in between". We may ask ourselves which are precisely the most similar groups, defining clear criteria for that. There are different algorithms which give similar results. Using these algorithms we can detect precisely which groups of people make up a community, understood as a group of people where the internal collaboration is more intense than with the rest.

Both the geometry and the communities depend on the kind of data we are analyzing; for example if you are considering Publications -> Indexed the results will generally be very different than if we consider Publications -> Excellence; and they will be even more different if we consider Project -> Funds.

Geometry becomes evident to the naked eye. To quickly identify communities, we can assign a color to each one, and color all of its members with the same color. This makes the structure of communities clear (in the following graph we have surrounded some with of them with a red circle to make it more obvious). In the application, coloring nodes according to the community to which you belong, corresponds to the option Color -> Automatic.

Projects

Let’s consider now the study of R&D projects.

The typology of projects is quite heterogeneous, and to have the most generic classification possible, they’re divided among the following categories:

  • Project type
    1. Research
    2. Transfer
    3. Others
  • Geographical reach
    1. Local
    2. Regional
    3. National
    4. European (EC)
    5. International (not european)
    6. Others

In projects we consider the following data:

  • Principal Investigator (PI). In general a single one
  • Co-Investigators (IC)
  • Start and end date
  • Funds
  • Project type
  • Geographical reach

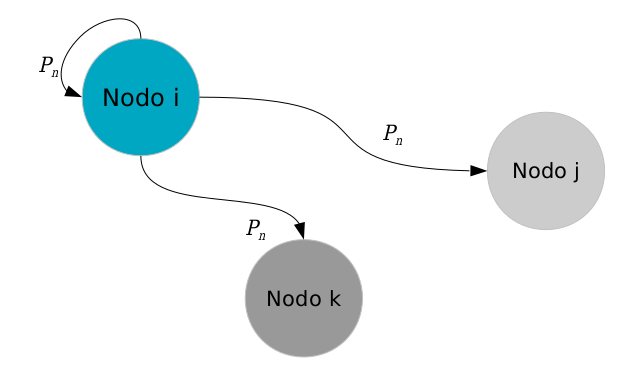
The collaborative network is now built. In the first place, connections (or links) are now not symmetrical because there are PI and CIs with very different roles in projects. We define the PI links as leaving towards CI and themselves.

The intensity of links can be fixed in two ways:

  • Number. The weight of each project is 1 divided by the number of signatories. This way the weight of a project only depends on the number of signatories and it is more importantly the less they signatories it has.
  • Funds.The weight of each link is equal to the project funds divided by the number of signatories, so that each link weighs the amount of money (evenly distributed) that travels through it.

Next we can see a graph for a simple project, with PI and 2 CI.

The crown or autoloop on a node indicates that it represents the PI of at least one project. In the number option, each link would weight 1/3. In the funds option, if the project funds are 30,000 euros, each link would weigh 10,000

Now we show 5 researchers that have 3 projects, each with a different weight, which manifests graphically in the different thickness of the links.

Collaborations

Apart from analyzing the activity in publications and projects separately, an important signal of how collaboration functions in an institution comes from the sum of both. This gives us a new, more integrated, and collaborative vision of the network. There are other important activities included here, which may depend on each institution. So we can analyze activity in patents, creation of spin-offs, doctoral thesis...

Publications and projects

A link is created fo each publication or project in common, weighing equally regardless of publications’ impact or projects’ funds. Each collaboration (publication or project in common) weighs 1.

Depending on the institution, other collaborations can be analyzed, for example

Patents

We analyze patent activity. The network is formed by connecting coauthors of each patent.

Spin-offs and Start-Ups

The business creation activity is studied based on the know-how generated at the institution.

Professorships

Stable collaborations between a company and a university.

Thesis

Study of the activity based on the realization of doctoral thesis. Other academic activities can also be considered.

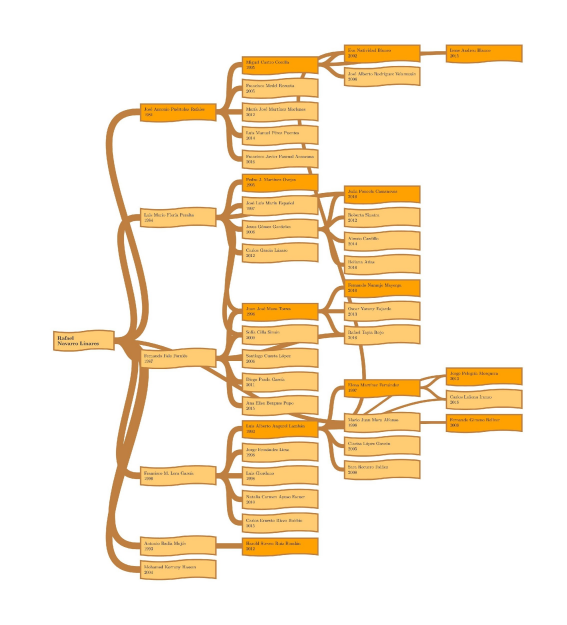
Doctoral Theses are at the base of the research, especially for the training of new researchers, being a process in which a large amount of scientific knowledge and discoveries are generated. Historically they have played an essential role in the transmission, propagation and generation of scientific knowledge, the learning processes and the maintenance of the cultural heritage. Following the historical activity in Theses, we can build a true genealogical tree of scientific development.

For each researcher, the number of Directed Theses is shown, a number that is also incorporated to calculate the general activity indexes.

However, beyond the numerical issues, the Theses indicate how is developed in an Institution the process of transmission of knowledge, the formation of research groups, leadership in the creation of new lines of research or the consolidation of existing ones.

For each thesis read, we consider its director (or directors) and the doctoral student. We build the following Collaborative Network: the nodes are all those researchers who have read or directed a Thesis; For each Thesis, we consider a link (union) directed (with arrow) that goes from the Director to the PhD student. Thus, we obtain a Directed Network where the activity around theses, hereditary lines, genealogy, related communities, cohesive or dispersed groups, etc. can be seen at a glance.

For a single researcher we can obtain his/her scientific genealogical tree.

Modifiers

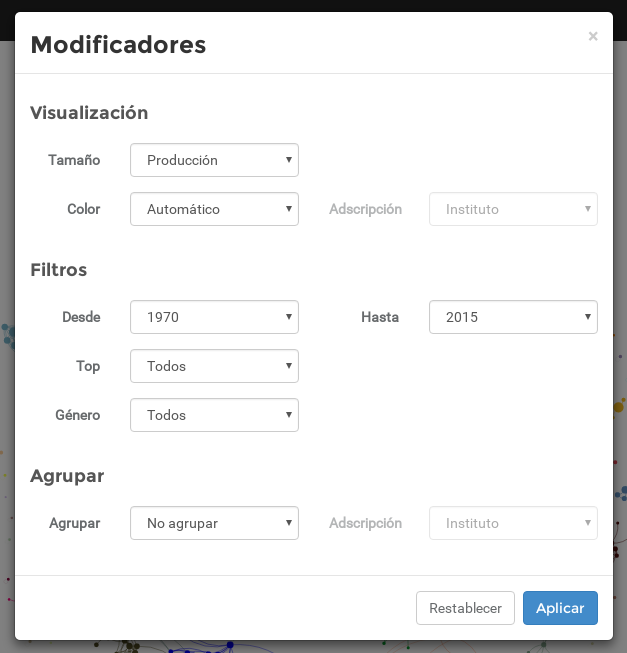
Here the options regarding visualization modes (size, color, etc) can be accessed, along with methods to group and aggregate researchers or ascriptions.

Generation and configuration of maps

The map shows the collaborative structure according to the information (publications, projects, collaborations) chosen and the specific weight parameters between relations (quartile publications, projects, funds, etc).

In the map nodes are showed, with a specific size and color for each one, in a specific position. Nothing is random, everything is determined according to well defined criteria and a concrete meaning.

After we select people and the type of network we want to see, we have a group of people (nodes) and a set of relations between them, relations that mean connections between people with a certain force (links).

Once nodes and links are defined, the first task is to build a map to assign each node a position on the map which gives us a quick visual idea on how the relationships work, showing the collaborative structure, communities, isolated and united people, etc.

This calculation requires some processing time in the central servers of the application. Once finished, the geometry of the network is available, with node positions and the lines that connect them.

But apart from geometry, we can choose many other parameters to display our map, for example, we will need to define how colors and sizes are assigned to each node or link.

We can also choose if we want to see all researchers, or hide some for clarity. We can even group them according to some criterion.

All of these options can be chosen here.

Viewing

The node size and color can be chosen according to multiple criteria

Size

Here you can choose what the size of each node means (the circle that represents each person). In general, quantitative data is associated with node area: that is, if a node has twice more data than another one, its area will be twice as big (therefore its radius will be a root factor of 2 greater). There are several options to associate with its size:

  • Production. It corresponds to the internal production of the researcher within the represented community.
  • Total production. It corresponds to the total production of each author, the sum of all selected merits, whether generated inside or outside the represented community.
  • Betweenness. The size is chosen according to the importance of the node to communicate and collaborate with its environment, specially as a person functioning as bridge between different communities, that is, the bridge role between individuals and communities.
  • PageRank. The relevance of the person defined as the quantity and quality of the relationships with important people in the graph. It is the criteria used by Google to order searches.

Color

We select the criteria to color each researcher:

  • Automatic The system identifies communities as sets of nodes that collaborate more closely, and all its members are colored alike. The links are painted with the color of the bigger node.
  • By ascription. We can choose that the color represents one of the organizations of the ascriptions of each node: for example Departments, Faculties, etc. Within each organization, given a faculty, we can choose the All option, in which each faculty is colored using a visible code or a specific faculty. In this case the faculty is colored using the corresponding color, and the rest in gray. This allows us to see the role played by each organization within others, identifying gaps or high densities.
  • Gender. The color is set according to the researcher’s sex. In this case we can discern the global role of men and women within the selected group.

Filters

It allows us to reduce the number of displayed nodes:

Year (from-to)

This option allows a quick visualization of some time period. Let’s recall that in selection a time period can be chosen. The difference is that when the period is chosen in selection, all the analysis is done in that period: geometry, communities calculation, merits list, etc, which is costly.

When this option is used in modifiers, geometry is not recalculated, instead, from the original maps, merits outside the period are deleted, but people’s location doesn’t change. In the lists only period’s merits are shown.

Top N

Displays and analyzes the N researchers with a greater production according to the selected parameters or the N as a percentage.

Gender

Women and/or men. It selects only people of one gender. If we use any previous top or gender option and this one, it first selects by gender, and on that selection, the corresponding top is made. (Not the other way around, which would give a very different result in general).

Group

This is an advanced option, which allows integrating results.

It allows grouping multiple nodes into one, according to certain characteristics. By default there is no grouping, and nothing is said in the descriptor. The group becomes a single circle replacing all the balls that share the grouping property. Each ball has links with others through collaborations (publications or projects) between people of different groups.

  • Automatic

    Given the natural communities of the whole, all members of a community are joined to form a single entity represented with a ball whose size corresponds to the sum of the activity of its members. Using this automatic grouping, the name of each node corresponds to the bigger node among those who compose that community.

    Note: Using this set of nodes (which actually represents clusters) the communities’ detection algorithm is executed, and the color we see now is automatic, that is to say, if we see several clusters with the same color it means that these clusters work together more closely.

  • By ascription.

    Suppose we choose for example Group by Department. In this case we see that all researchers in the same department are joined and become a single node with the department name, the size of the total production of the Department, and the links indicate collaborations between researchers from different departments.

    Note: In this case the name of each node (Community) is assigned as the name of the organization that corresponds to the grouped one: for example, if it is grouped by department, the name of each node will be the name of the corresponding Department. If we group by the institution, the color is always automatic.

  • By gender. In this case we will see two balls. All men are integrated in one of them, and all women in the other one. Each ball is sized according to the selected criteria, and all together they show the intensity of collaborations.
Note on colors and groupings

It’s necessary to pay attention when using the grouping option along with color options.

When grouping, nodes with the same criteria are collapsed. For example, if we choose Group -> Automatic, all members of each natural community are collapsed to a single node. If we would like to color by department for example, in general, we will find members of different departments inside the ball, so the color selection is ambiguous. To avoid problems, when we group nodes by any criteria, the color can not be chosen and the system always colors automatically.

Statistics after grouping

After grouping, the map shown has balls that represent a group of researchers. Let’s take as an example that it’s grouped by department, so that each ball is a full department.

If production is clicked on after that, the merits by departments will be listed. A section on total production will be revealed, along with an internal production (where links will be discounted with other departments, but let’s focus on total production for simplicity’s sake).

If we are on Data -> Indexed -> Number, for each department a sum of published publications by every one of their members is shown. Suppose that in a department with 10 members, 80 different publications have been signed, so that a member has published 35 publications, another one 25, and the rest of them 10 publications each. In total the production would be 35+25+10*7=140. This corresponds with the merit sum of every person, so publications signed between them would be counted multiple times: instead of 80, 140 would be the result.

If the net production of the department was to be seen, and not the individual merit sum (that is, 80 instead of 140), the divide between number of signatories option should be chosen inside data. This way merits won’t be duplicated, every researcher receives the proportional part for every merit, so when adding up the unit value will be restored.

Como aclaración supongamos un Departamento con dos personas (a,b). Han publicado entre los dos 8 artículos. % firmados por ambos, 2 firmados sólo por a, y 1 sólo por b.

The total production of a would be 7, b’s would be 6. If we group by department, in production we’ll see 13. If using the divide by number of signatories option, the production of a is (5/2) + 2 and b’s is (5/2) + 1. The department’s total will be its sum, precisely 8.

Production

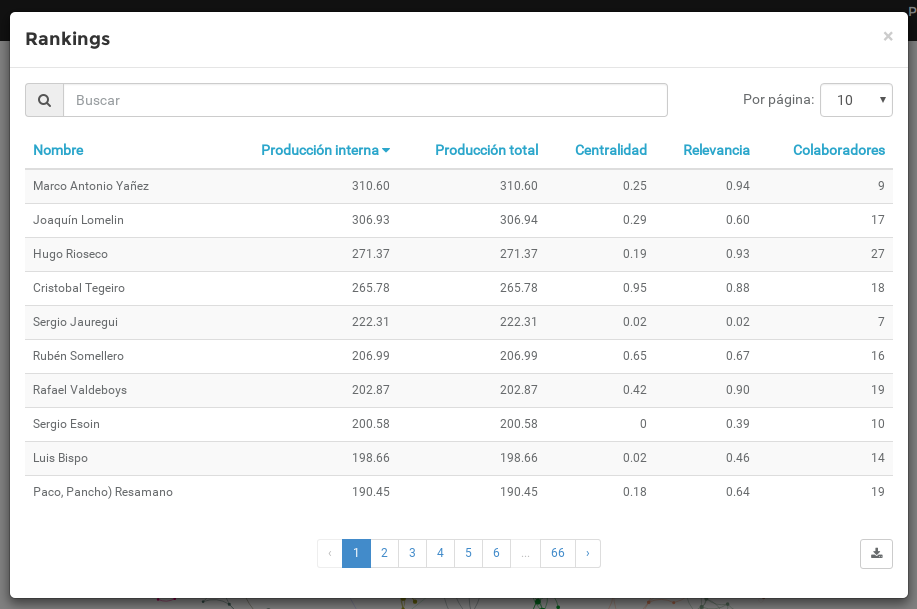
Here, the results associated with the selected group are shown in tables and graphs according to the data (publications, projects or collaborations) and selected parameters (impact, excellence, funds, etc...). There are individual statistics and data related to the network and its structure. To understand some of these data points, the concept of domestic production vs total production should be clarified.


A table with the following columns is shown:

Name Internal production Total production Betweenness Relevance H-index

The columns can be sorted directly or inversely using each field. By default, alphabetical order (by name) is chosen. The number of researchers that are shown can be tweaked.

Total production refers to that of the selection. For example, if we choose department and all publications, for each researcher it’ll show how many publications he has published. In internal production, the last number will be discounted from the proportional part of signatures with researchers outside that department.

Betweenness gives a metric of relevance to connect groups between them, and page rank gives a metric on how many important people the user is related to.

H-index give us a measure of the scattering of citations between the articles.

This list can be downloaded as an editable file.

Note on internal and total production

Let's suppose a group of articles and their signatories is being analyzed. Note that this is not common in Kampal: commonly you'd set a group of people and then choose the publications in which at least one of them appears from the given list. If the list of all signatories from the chosen publications is generated, in general it'll contain other signatories, whom we won't have publications from (those fully signed with people outside the selection). However, let's suppose that we have a closed system: all people and all publications.

In such a system, all collaborative links will be inside the graph, and if we add the values of all links on the node, that number matches the node’s total production. For example, if a researcher has signed 3 publications with impact=2.2, 1.3 and 0.3, the sum of the links will give 3.8, and the total impact of that person will be 3.8 (not using a normalized flag).

Let's suppose that we now have an N person graph. It’s quite likely that when considering their publications, there’d be more researchers than the originals, researchers that have signed some publications with the original selection but others with different researchers. If we form the graph with the original authors and we draw their weighted links with the total number of authors, some links won't be present on the graph. If we sum some node's links, since some of them are lost, its sum will be lower than the total productivity. This sum now represents the researcher's activity inside the drawn graph, indicating how much of their activity is inside and how much is done outside, what is the internal collaboration and external. (A similar discussion applies to the project case presented below.)

When you select All and deploy Production, domestic production and external is identical, because nobody is outside.

Note: strictly for the total institution, an university for example, there are people "outside", but the starting point is to assume that for the total institution, the links drawn are the total ones. This way in Statistics -> Properties with All as the selection, Internal Production and Total Production columns are equal.

When we look at a research institute, the previous columns are no longer the same. Total production corresponds to the sum of all the merits of each researcher, and coincides with that shown when All was used. However internal production column shows now lower values, corresponding to the activity carried out within the selection, according to what we explained above: the links with people outside the selection are cut and therefore the person who should go loses on its merits the value of the link (impact / number of signatures, for example).

A big difference between total production and internal production indicates that most of the contributions are made with people outside of the selection. This may be an indication that the researcher makes few collaborations in the selected group. On the other hand, if both quantities are very similar, it is an indication of poor collaboration with different people in the selected group.

Communities

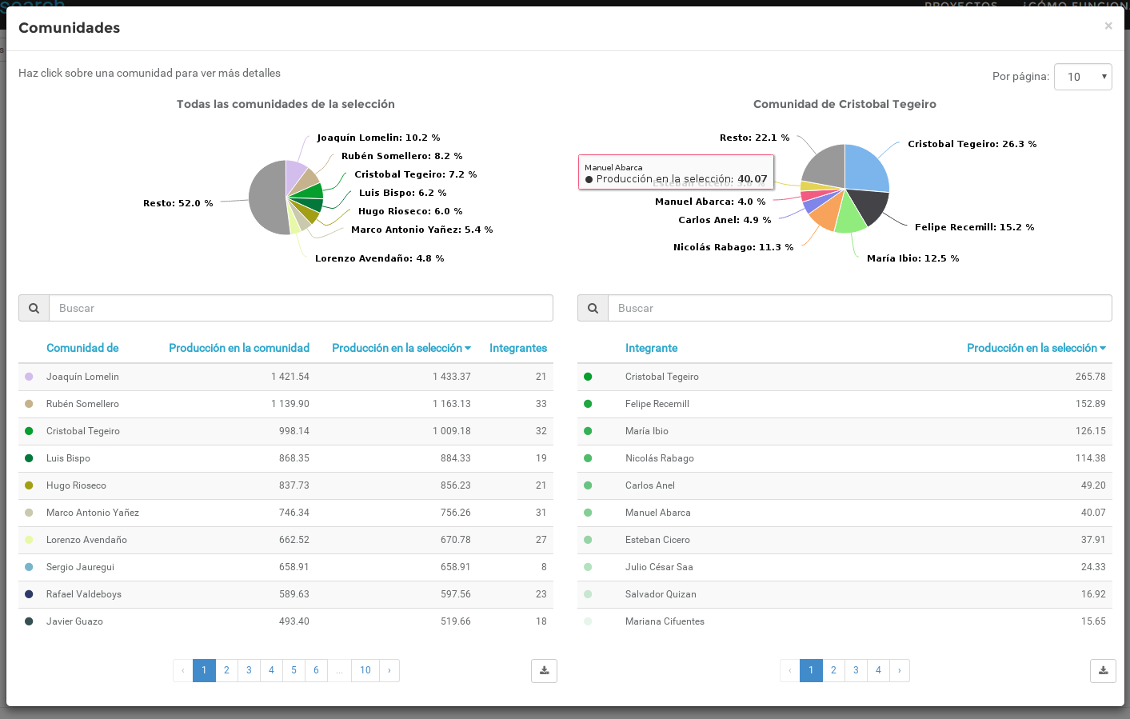
For each map the system identifies the groups that collaborate with each other more actively. This group is called "Community". Each community is identified with the name of the member with the highest productivity. The productivity of each community is calculated as the sum of the productivity of its members. In the list on the left, all communities appear, identified by the the highest degree member and the community’s total productivity. If we click on one of them, the list of its members appears on the right, with the degree of each of them. In the list of communities, each row is colored according to how the member of highest grade is colored in the graph.

We see a column with Production in the community and the another one with Production in the selection.

These numbers tell us how much activity is performed in each community within the current selection. This way when the Production in a community is much smaller than Production in the selection, it tells us that most of the contributions are made with people outside their community. Recall that community refers to the group of researchers in the selection that work more regularly. It is a subset of the selection. Within this community we also have the internal production, and collaborations with people from other communities. The sum of all community members’ production appears in the columns. If we weigh only internal links, we get the Internal Production column. If we add all the links of the whole selection, we get the Production in the selection.

Note that the latter is different from the Total production, and it coincides with the sum of the production of all members in the community. If we dropdown a community, all members appear, and we can their production in the selection.

Let’s check its meaning with more detail.

Production in the community and in the selection

Production in the selection

It corresponds to the sum of the internal productions of the selection considering all members of the community. This production is not the sum of the total output of its members, because we have eliminated the merits contracted with members outside the selection.

Production in the community

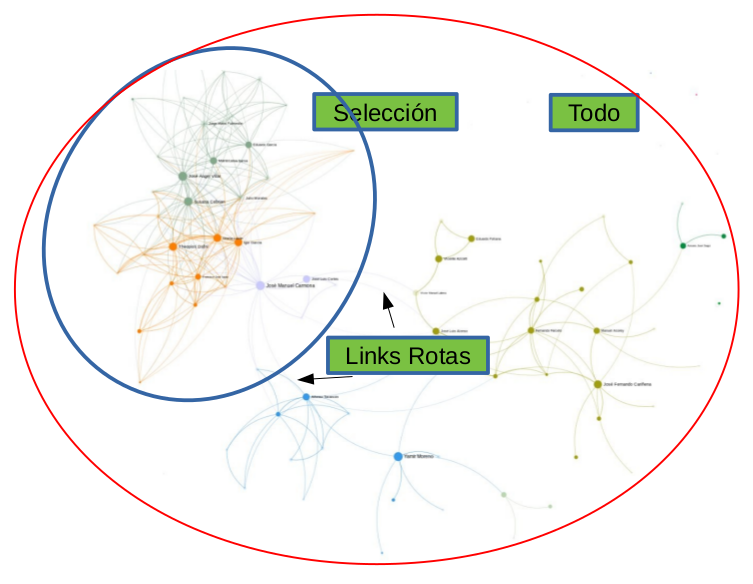
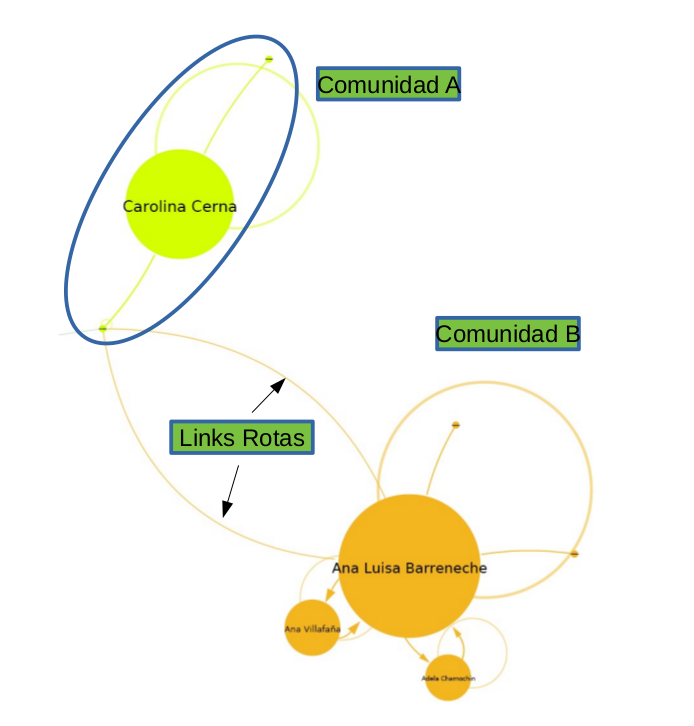
For each member of the community, we calculate the production made with members of their same community, removing the merits with members of other communities, which is what we call broken links (and of course removing the merits starting with nodes outside the selection). We add the production of all members of the community and we get the Production in the community.

Note on communities and groups

When not grouping, the community list is calculated as explained above, where the color of each row in the table corresponds to the color of the community’s graph, always starting from automatic color. This is to say that independently of the chosen color in the map, when looking at communities they’re colored according to the assigned color in the automatic color’s map.

When a community is listed, it is colored based on the color of his representative.

Let's suppose now that we select to group. First of all we have to remember that the Color option is now set to Automatic by the system.

Let's suppose we Group -> Automatic. In this case, each natural community collapses into a single node, with its name taking the more productive person’s one. So we have a lower number of nodes than initially. We can see in the graph that there are multiple nodes with the same colors. This means that the system has executed a community detection algorithm using the communities formed earlier as its basis: that is to say, it has formed Super Communities, and each of the original communities that form it are colored the same way now, using a color chosen by the system. If we now go to Communities, we see a list where each row corresponds to a Super Community, identified by the name of the larger community it contains, identified by its higher productivity member. If we click on one of these Super Communities, to the right we can see the list of the original communities that form the new one, each one identified by their most productive member.

When we perform another kind of grouping, its behavior is similar. Let's suppose that we group by department. Each node contains all researchers of the graph that belong to the same department, and each node is identified with the name of said Department. Next, we perform a detection of Super Communities. This way we detect which departments work closer together, and each group of departments identified is colored with the same color. Then, we will have a community with 4 departments, one with 3, etc, for example. If we access Communities, each row in the list is a Super Community identified by the name of the department with a greater productivity among them, and the statistics correspond to the production of each Super Community. By clicking on a Super Community we see the list of communities that form it, in this example, a list of departments with their productivity. The grouped graph is always shown in automatic color. This way similar departments (collaboratively speaking) have the same color.

Evolution

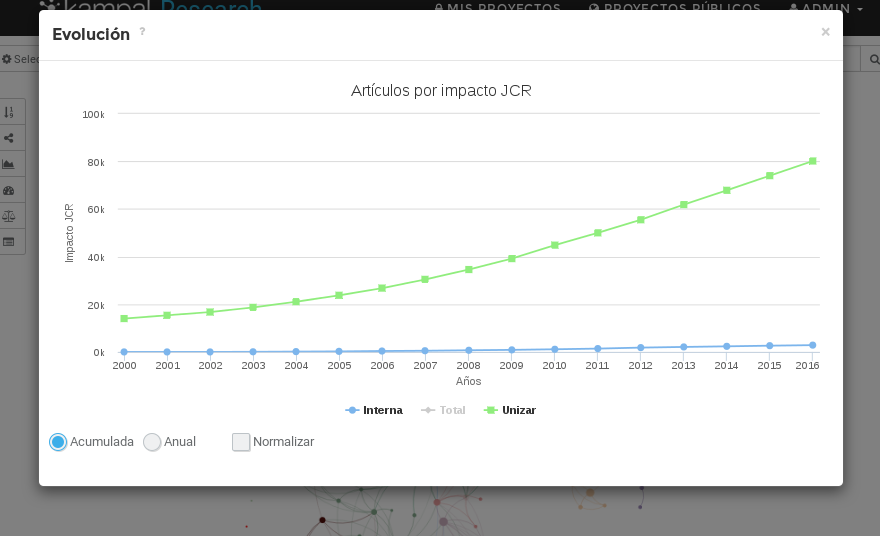
We can see the historical productivity of the selection. You can see up to 3 curves:

  • Internal production. Activity developed within the selection or graph.
  • Total production. The community’s total activity, both internal and with external members.
  • Reference production. Internal production of the reference institution

For each of these options, three different viewings can be chosen.

Accumulated: Accumulated production every year. It’s always increasing.

Internal production Yearly: Yearly production.

By person and year: Both the total and yearly production depend on the number of people in the selection and the number of years since its inception. To compare this in more detail, with this option per capita and per year production is shown. For each year, the production to number of members ratio is considered. This way if a department was created 5 years ago, with a yearly production of (4, 4, 5, 7 and 8), and number of members each year (3, 3, 4, 5 and 4), we’ll have its evolution (4/3, 4/3, 6/4, 7/5 and 8/4).

Network properties

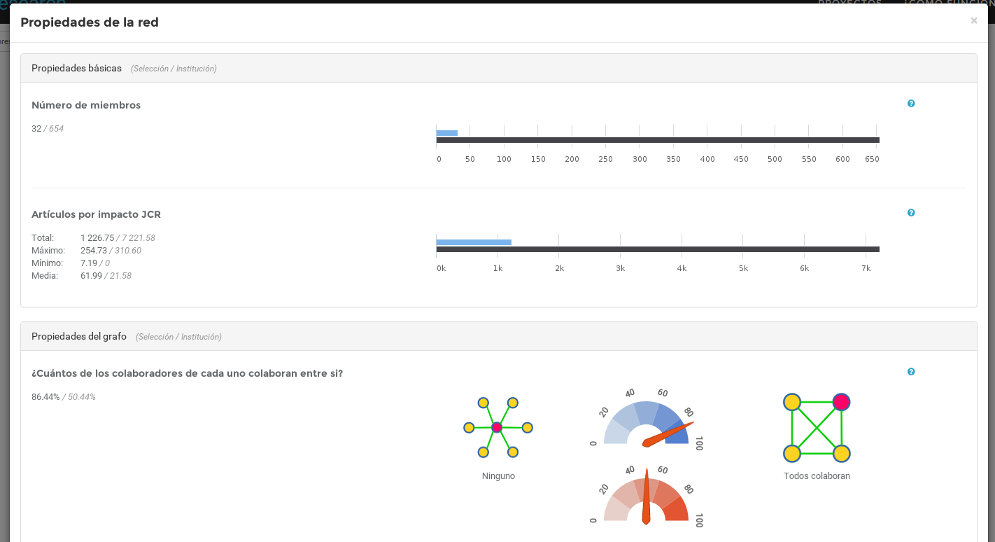
They are numerical indicators of results related to the structure of the network. It tells us how the collaboration among people is, if there are well-defined subclusters, if people work with researchers that have a relevance similar to their own or not, how woven it is, etc.

For each property we indicate numerically or graphically the comparison between the whole Institution (unless we are precisely in the total institution.)

You can access an online explanation for each property.

List of properties

Here we can find the global network properties listed, both in statistically terms and on their collaborative structure. For each property the result is graphically displayed, and an explanation of what it represents can be accessed.

  • Number of members. Number of selected nodes, including the total ones
  • [Data] number. Data on publications, projects or collaborations are displayed as selected.
  • Clustering. It tells us how many of the people related to me are interrelated. In a star network, this number is very low. In a network of all among all, it is high. In other words, it indicates whether the nodes are closely related to their environment. Higher values indicate a very cohesive network. [0, 1].
  • Assortativity. It indicates if all researchers collaborate with the same number of people. In a clearly hierarchical network, heads collaborate with no head researchers, but never with other heads. No head researchers only collaborate with heads. Roles are not mixed. Thus, this is how nodes prefer to join with each other. If positive, there is a tendency to collaborate between similar nodes. A negative value indicates a tendency to collaborate among different nodes. [-1, 1].
  • Modularity. It indicates whether the coherence of the network is very sensitive to small changes, for example, it indicates whether the disappearance of a single node divides the network into two or more disconnected parts. It measures the presence of well-defined subclusters in the network. Subcommunities networks with intense collaborations but with few collaborations between subcommunities have high modularity. [0, 1].
  • Central nucleus. Giant Cluster network, or giant component, defined as the largest set of nodes in which all are connected through collaborations. That is, the greater subnetwork where you can go from one to another through links.
  • Internal Activity Index. It indicates that part of the activity is developed in collaboration with members of the selected network. It is the ratio of internal production to total production, and it is in the range [0, 1]. A value of 1 indicates that all production is internal.
  • Average distance. For each pair of nodes the distance between them can be defined as the number of links that separate them along the shortest path. This quantity is the average of these distances.
  • Maximum diameter. If we want to communicate whichever two nodes, the number of steps is less than or equal to this number.

Individualized report

While this functionality is accessible from the popup that appears clicking each node as described, after entering the needed ideas, and because it contains similarities with the functionality Report Selection that is accessible from the viewer.

The report graphics and images can be downloaded.

Summary

A researcher’s activity report.

Some data is given about the activity and quality of publications and projects.

To frame the researcher’s activity, a study is made on the position that he plays inside the current selection. This way, his relative position can be known inside a department, institute, or even inside the whole institution, varying with the selection at the time of requesting the report.

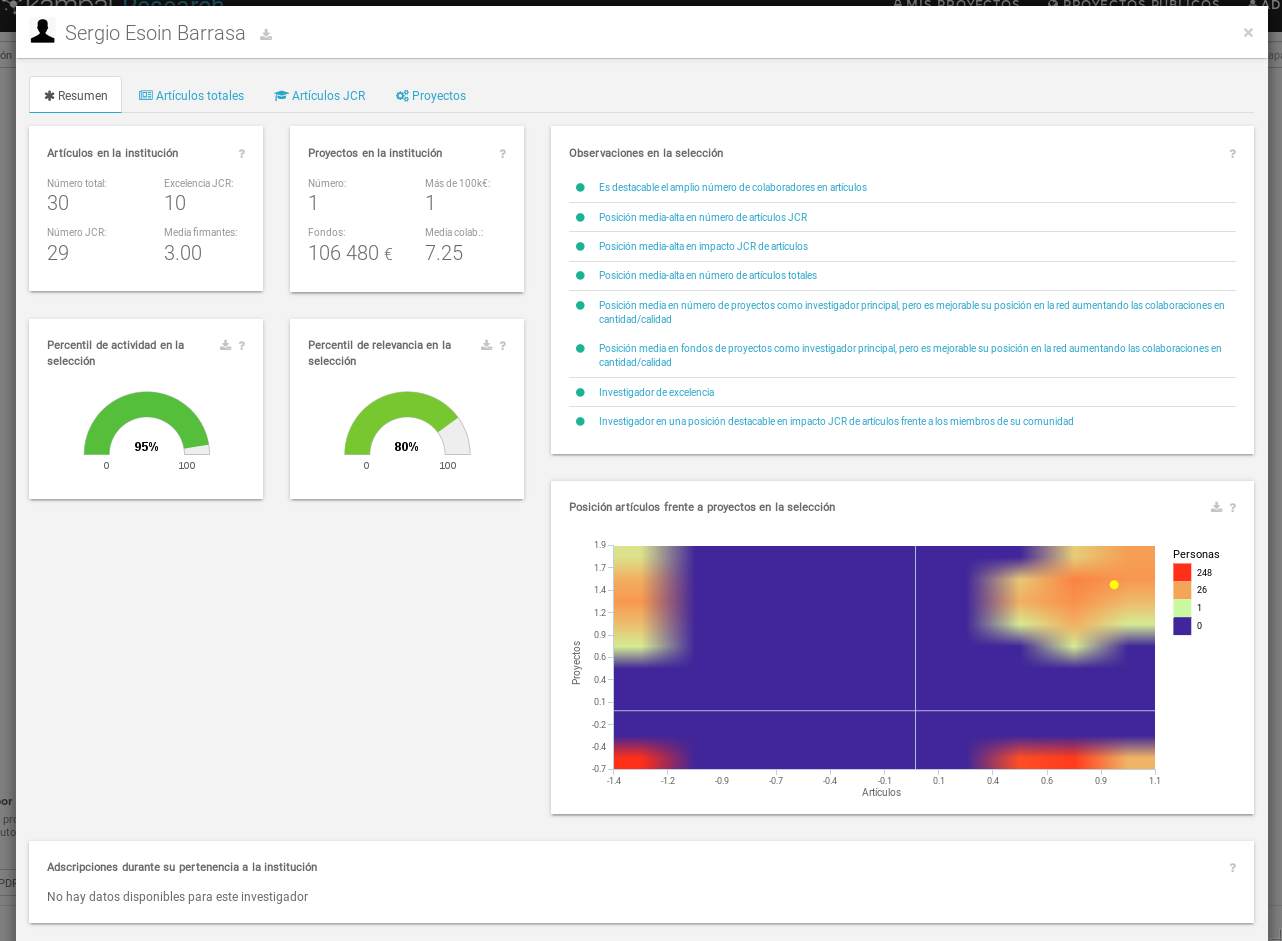
Activity position

The position is defined here as the average between the production by publication’s papers and fund generation in projects as PI (Principal Investigator). Then, his percentile is calculated.

Relevance position

Defined as the average between Betweenness and PageRank; it indicates the researcher’s role as an information hub and collaboration with relevant people inside the network.

Important note about the distribution of the activity

The production distribution is heavily biased towards low productions. In particular, the probability of finding a researcher with production x obeys a law of the type p(x) = axx > 0

This means that there are more researchers with low productions, and fewer with high productions. A percentile calculation makes it so that all researchers fall into the lowest percentiles, providing few details. To avoid this, percentiles are made in logarithmic scale, so that the researcher’s distribution by percentiles is more homogeneous and gives more information.

Heat map in publications and projects’ production

Here we show which is the relative position that the analyzed researcher falls into inside the current selection when it comes to his production in publications and projects.

For the selection, we know the production of publications from all of his members, so we know the mean, and the standard deviation. To show the relative position of the researcher inside the selection, the distance of his production to the mean is calculated, in units from the standard deviation, that isd = (x-m)/σ Thus, if the distance is very low, it will be close to the average. if d is positive and high, it will be a prominent researcher in the set. If it is negative, it means that their productivity is below average.

This calculation is also made for project funds.

Now we make a map of the whole selection with the intent of using it as a reference: to that end the quantity d is calculated for publications and funds for each researcher selected. After that, a two-dimensional histogram is made, counting how many researchers fall in a given grid of distance to the mean for publications and projects. Because to draw histogram a three-dimensional plot would be needed, a heat map is produced, where color indicates height, meaning the number of researchers that fall in each two-dimensional interval.

A red color would indicate that there are many researchers on those distances to the mean. A blue one would be that there are no researchers with those numbers.

Once the heat map is drawn, we place a yellow dot corresponding with the position of the selected researcher. A position in the mean (identified with two straight lines) shows that the researcher is placed globally (publications and projects) in the mean. If it’s placed in the upper right corner, he’s excellent at both activities. If it’s placed on the bottom right corner, his production with publications is good, but weak in projects, which in general indicates that even with a good publication activity, he hasn’t generated projects independently as an PI, and should be a warning to try and improve in this regard.

A researcher in the upper left corner shows that he has a relevant role as an PI in projects with high enough funds, even if this prominent position isn’t proportionally reflected in his scientific publication production.

Researchers in the bottom left corner shows a low activity on both publications and projects, which could fit people that don’t work on R&D, young researchers, or people whose scientific production should be improved in general.

Alerts

Information is shown about significantly high or low activities, both in absolute terms and relative to the current selection.

The publication’s analysis is done in two sections. Firstly, the total set of registered publications in the institution is analyzed (total publications) and then the indexed ones. In both cases the study is similar with some differences that will be pointed out when necessary.

Publications

Specific analysis of publications. First we see some statistics.

Position by activity and relevance

Percentile analysis regarding the selection of scientific production, calculated from the total number of publications, which will be again in a logarithmic scale.

Selection positioning

The selection’s production histogram is shown here. Boxes are made for the production, and how many researchers fall into each box. The box where the analyzed researcher falls into is colored red. To make things clearer, it can be chosen to see the production axis (X axis) in linear scale or logarithmic scale.

Positions to the right point towards high productivity, and to the left, lower ones.

Heat map of scientific production and betweenness

For a given researcher his position in the production-betweenness inside the selection is studied now. Its construction is similar to that of the production’s heat map in publications and projects, but now using the data from the publications-betweenness production in the publications’ network.

A position on the upper right corner shows a researcher with high productivity and high relevance in the network. A researcher to the bottom right corner shows a researcher with high scientific production with low relevance: this could be because his collaboration is not as important or because there aren’t collaborations inside the selected network. In any case, it’s a warning sign.

The ones in the upper left corner are researchers with low productivity but high relevance, in general authors with not many publications but with many collaborations among diverse groups, making bridges between them. They’re the best ones when it comes to promoting collaboration and interdisciplinarity, and should be paid attention to: if, for example, measures are taken to promote their activity, it will positively impact the network’s cohesion.

Projects

All the researcher’s projects are analyzed. Some statistical data is given and similar additional information to those exhibited for publications.

It should be recalled that the collaborative project network is different from the publications network in the sense that there is a Principal Investigator (PI) different to the remaining co-investigators (CI). In this network it is natural take into account funds for the PI, not for the CI, so that the activity goes to the first. The shown data are similar to publications data.

Comments

The observations indicate special or striking situations, both in terms of high or low activity, in each of the different analyzes. They are comparative data that indicate that the researcher analyzed is located away from the central region.

General remarks

  • The researcher has no indexed publications.
  • The researcher does not have projects as PI.
  • The researcher has no publications in the first decile or projects in excellence as PI exceeding 100,000€.
  • The number of co-investigators in publications or projects is very low.
  • Distinguished researcher. It has publications and projects and is well above average in both activities.
  • Maladjustment in the position of the decile by indexed impact publications and projects funds as PI. (The difference in the occupied decile by publication impact and project funds is greater than 6).

In previous observations "low" means that it is placed in deciles 1 or 2 within the selection. And "very high", that it is located in deciles 9 or 10.

Observations for joint activity in publications and projects

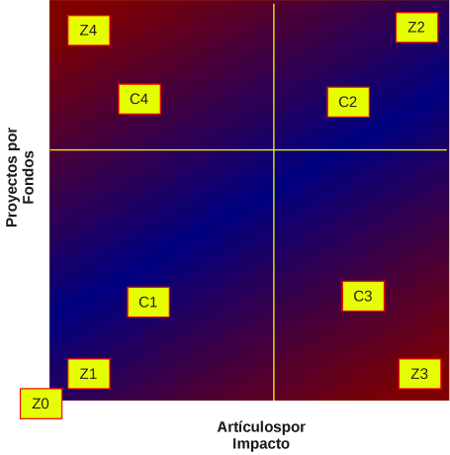
We consider the activity in publications by impact and funds as PI, and we calculate the position of the researcher in the heat map production - centrality, and it is classified according to the following chart. The zones are defined as follows

  • C1: below average in publications and projects
  • C2: above average in publications and projects
  • C3: above average in publications and below in projects
  • C4: below average in publications and above in projects
  • Z0: Absence of activity in publications and in projects as PI
  • Z1: Decile 1, 2 in publications and projects
  • Z2: Decile 9, 10 publications and projects
  • Z3: Decile 9, 10 in publications, 1, 2 in projects
  • Z4: Decile 1, 2 for publications, 9, 10 for projects

The generated observations are as follows:

  • Z0: Researcher without significant activity
  • Z1: Researcher with low overall profile
  • Z2: Excellent researcher
  • Z3: The researcher must/can ask for projects
  • Z4: The researcher must/can ask for more publications
  • C1: medium-low activity, could be improved on publications and projects
  • C2: medium-high Activity
  • C3: On average but improvable in projects
  • C4: On average but improvable in publications

Comments on publications or projects

Now we consider a particular activity, such as impact publications. We build a similar graph for each network above, but now the activity is located in the X axis, and the centrality of the researcher in that particular network on the Y axis.

The alerts are as follows:

"Network" in this case this means the network type of the analysis and it can be:

  • Publications by indexed impact
  • Number of publications
  • Projects funds as PI
  • Number of projects as PI

We study each one separately.

  • Z0: Researcher without significant activity in the network
  • Z1: Researcher with a generally low profile in the network
  • Z2: Researcher with great production and influence in the network network
  • Z3: Great production but low interaction in the network network
  • Z4: Great presence and influence in the network of network but low production. The researcher must/can increase their number of publications/projects
  • C1: medium-low position in the network
  • C2: medium-high position in the network
  • C3 and C4: Average position in thenetwork

Comunidades

The role played by the researcher in impact publications and project funds within its collaborative network is analyzed and observations are generated in the following cases:

  • Positive/negative alert if the researcher has a high/low position against members of their community. If it is placed in decile 1 negative warning. If it is in decile 10, positive alert.
  • Negative alert if the researcher is isolated (single member in their community).
  • Negative alert if the researcher is community leader and should increase its activity: if the researcher output is less than twice the average production of other researchers in their community.

Selection report

Through this option we access a report on the current selection, both in a global way and in a detailed one for their members.

With this option a report on the current selection can be retrieved. It contains multiple sections which will be described next. The purpose of it is to give the big picture on the selection and to place the selection inside the institution (for example to know the activity of a department in its absolute and relative terms to its university).

This functionality also allows us to compare the different entities that compose the institution among them. This way, when choosing a research institute we could also see all the data relative to that institute, a comparative with the main indicators from all institutes in the university.

The report graphics and images can be downloaded.

Summary

Global vision of the selection. A graph is shown of the scientific production’s evolution, and the securing of funds by the selection’s members, both accumulated and yearly production.

In publications the total production can be seen, and the internal production to the selection.

In projects, on the one hand the sum of funds of the selection’s PIs is shown, on the other the sum of these funds discounting the proportional part corresponding with the members not present on the selection.

A graph is shown with the ratio of men and women in the selection (considering all the members on the selection, that is all the people selected that have an publication or participate on a project).

Membership evolution

Temporal evolution of:

  • Members belonging to the selection over time.
  • Members of the selection that are PI of at least one project.

Personal report

This functionality is available from the popup that appears over each node.

The information gathered in the visible report on the web summarized report is detailed as follows.

Summary

A researcher’s activity report.

Some data is given about the activity and quality of publications and projects.

To frame the researcher’s activity, a study is made on the position that he plays inside the current selection. This way, his relative position can be known inside a department, institute, or even inside the whole institution, varying with the selection at the time of requesting the report.

In each of the sections, a set of observations is given, where information is shown about significantly high or low activities, both in absolute terms and relative to the current selection.

Activity position

The position is defined here as the average between the production by publication’s publications and fund generation in projects as PI. Then, his percentile is calculated.

Relevance position

Defined as the average between Betweenness and PageRank; it indicates the researcher’s role as an information hub and collaboration with relevant people inside the network.

Relevance position

The production distribution is heavily biased towards low productions. In particular, the probability of finding a researcher with production x obeys a law such as p(x)=ax^-α, x>0.

This means that there are more researchers with low productions, and fewer with high productions. A percentile calculation makes it so that all researchers fall into the lowest percentiles, providing few details. To avoid this, percentiles are made in logarithmic scale, so that the researcher’s distribution by percentiles is more homogeneous and gives more information.

Heat map in publications and projects’ production

Here we show which is the relative position that the analyzed researcher falls into inside the current selection when it comes to his production in publications and projects.

For the selection, we know the production of publications from all of his members, so we know the mean m, and the standard deviation σ. To show the relative position of the researcher inside the selection, the distance of his production x to the mean is calculated, in units from the standard deviation, that is d=(x-m)/σ. This way, if the distance is very low, it’ll be close to the mean. If d is positive and high, he’ll be a prominent researcher in the set. If it’s negative, it’ll mean that his productivity will be below average.

This calculation is also made for project funds.

Now we make a map of the whole selection with the intent of using it as a reference: to that end the quantity d (see above) is calculated for publications and funds for each researcher selected. After that, a two-dimensional histogram is made, counting how many researchers fall in a given grid of distance (in units of σ) to the mean for publications and projects. Because to draw histogram a three-dimensional plot would be needed, a heat map is produced, where color indicates height, meaning the number of researchers that fall in each two-dimensional interval.

A red color would indicate that there are many researchers on those distances to the mean. A blue one would be that there are no researchers with those numbers.

Once the heat map is drawn, we place a yellow dot corresponding with the position of the selected researcher. A position in the mean (identified with two straight lines) shows that the researcher is placed globally (publications and projects) in the mean. If it’s placed in the upper right corner, he’s excellent at both activities. If it’s placed on the bottom right corner, his production with publications is good, but weak in projects, which in general indicates that even with a good publication activity, he hasn’t generated projects independently as an PI, and should be a warning to try and improve in this regard.

A researcher in the upper left corner shows that he has a relevant role as an PI in projects with high enough funds, even if this prominent position isn’t proportionally reflected in his scientific publication production.

Researchers in the bottom left corner shows a low activity on both publications and projects, which could fit people that don’t work on R&D, young researchers, or people whose scientific production should be improved in general.

The publication’s analysis is done in two sections. Firstly, the total set of registered publications in the institution is analyzed (total publications) and then the indexed ones (indexed). In both cases the study is similar with some differences that will be pointed out when necessary.

Total publications

Specific analysis of publications in both indexed and not indexed journals. All the publications are weighted equally, without any additional quality criteria.

Statistical data

It shows the number of publications, excellent publications (first decile) and total impact.

Position by activity and relevance

Percentile analysis regarding the selection of scientific production, calculated from the total number of publications, which will be again in a logarithmic scale.

Selection positioning

The selection’s production histogram is shown here. Boxes are made for the production, and how many researchers fall into each box. The box where the anaylized researcher falls into is colored red. To make things clearer, it can be chosen to see the production axis (X axis) in linear scale or logarithmic scale. The Y axis is the number of researchers whose production is inside a box. For example, if a box with values between 3.5 and 8.7 (X axis values) has a height of 45 (Y axis values), that means that in the current selection there are 45 people with a production in such interval ([3.5, 8,7]).

Positions to the right point towards high productivity, and to the left, lower ones. The red bar shows the position of the researcher.

Heat map of scientific production and betweenness

For a given researcher his position in the production-betweenness inside the selection is studied now. Its construction is similar to that of the production’s heat map in publications and projects, but now using the data from the publications-betweenness production in the publications’ network.

A position on the upper right corner shows a researcher with high productivity and high relevance in the network. A researcher to the bottom right corner shows a researcher with high scientific production with low relevance: this could be because his collaboration is not as important or because there aren’t collaborations inside the selected network. In any case, it’s a warning sign.

The ones in the upper left corner are researchers with low productivity but high relevance, in general authors with not many publications but with many collaborations among diverse groups, making bridges between them. They’re the best ones when it comes to promoting collaboration and interdisciplinarity, and should be paid attention to: if, for example, measures are taken to promote their activity, it will positively impact the network’s cohesion.

Indexed publications

Publications published by the researcher on indexed journals are analyzed here. In this case different metrics based on the impact or the percentile of said journals in its year of publication are used.

Projects

All the researcher’s projects are analyzed. Some statistical data is given and similar additional information to those exhibited for publications, considering now all the registered projects.

Transfer

Similar to the previous point, but specifically with transfer projects.

Full report

The full report has all the previous information properly fulfilled and commented, along with other relevant information.

The report is generated offline, and an email address is requested where it’ll be sent once generated; when first generated the waiting time will be a couple of minutes, afterwards it’ll be instant.

This report is only accessible to privileged users.

Selection report

With this option a report on the current selection can be retrieved.

It contains multiple sections which will be described next. The purpose of it is to give the big picture on the selection and to place the selection inside the institution (for example to know the activity of a department in its absolute and relative terms to its university).

It also compares the different entities that form the institution between them. This way when a research institute is selected, all the relative data on the institute can be seen, a comparative of the main indicators with all the institution’s institutes.

Two kinds of reports are also generated: summarized and full. The summarized one can be checked out online or in PDF, the second one only in PDF, sent by email.

Let’s see next the summarized report.

Summary

It gives an overall vision on the selection.

A graph is shown of the scientific production’s evolution, and the securing of funds by the selection’s members, both accumulated and yearly production.

In publications the total production can be seen, and the internal production to the selection.

In projects, on the one hand the sum of funds of the selection’s PIs is shown, on the other the sum of these funds discounting the proportional part corresponding with the members not present on the selection.

A graph is shown with the ratio of men and women in the selection (considering all the members on the selection, that is all the people selected that have a publication or participate on a project).

Top 10

For each researcher in the selection his average position in publications’ production and project funds is calculated, showing here the top 10. To extract these positions, a weighted average of the percentile where a given researcher falls in different metrics (total publications, indexed publications by impact and excellence, project’s funds, etc) is used.

Top 10 inside the institution

The selection’s members placed among the top 10 inside the institution are shown here.

Position inside the institution

The publications and projects heat map is drawn as a background for the whole institution. Then for each member in the selection, his position in this graph is calculated, drawn as a yellow dot.

This gives us an idea on the activity distribution of the selection in comparison with the institution’s: a similar dot distribution shows similar activity to that of the institution’s. If there are too many dots in the upper right corner it shows that the presence in the selection of a higher number of excellent researchers (high number of publications and projects) inside the institution.

A similar case is applied to different situations with point distributions.

Total publications

The set of published publications in the selection from the registered ones in the institution is analyzed here, whether they’re published in indexed or not indexed journals. In this case all the publications are considered to have the same weight, without any distinctive quality criteria.

Statistical data

Firstly the statistical data relative to the accumulated production in the selection is shown. The total number of publications is shown, the excellent publications (first decile) and total impact.

Above the publications’ signatures, the average number of signatories is given, and a percentage of signatories’ repetition (as extreme cases, 0 shows that all publications are signed by only one person, 1 shows that all publications are signed by everyone).

There are scientific areas where the number of signatories is lower than others (for example maths against astrophysics). And there are areas where it’s more common than others to share signatures (legal areas against experimental ones, for example). The previous numbers are markers on how the selection’s publications are signed.

Evolution

The yearly evolution of publications’ production is shown here, with different markers, both yearly and accumulated and by person and year.

Gender

Percentage of women and men with published publications.

Top 10

The top 10 in number of total published publications.

Gender

Percentage of women and men with published indexed publications

Top 10

The top 10 in the scientific production table by impact

Top 10 inside the institution

The researchers inside the institution that are placed in the top 10 by number of total publications.

Statistical data

It shows the number of publications, excellent publications (first decile) and total impact.

Evolution

Now it is possible to see different metrics: Number of Indexes, Excellence, Quartile or Impact.

Gender

Percentage of women and men with indexed published publications.

Top 10

Top 10 on scientific production by impact.

Gender

Percentage of women and men with published indexed publications

Top 10

The top 10 in the scientific production table by impact

Top 10 inside the institution

The researchers inside the institution that are placed in the top 10 by number of total publications.

Statistical data

In the first place, statistical data relative to the accumulated production in the selection is shown. The total number of projects and total funds as the sum of funds which PI is in the selection when they where granted is shown. The number of the most relevant projects is also pointed out (those with an amount above 100 thousand euros).

The member's average in projects is shown.

At the end, an internal/external activity index is calculated as follows. First, the total production is calculate as the sum of all projects’ funds which PI is in the selection. Then, the amount proportional to the members in the project whom aren’t in the selection is subtracted, and the final is named internal production.

For example, on a project with 40 thousand euros, whose PI is in the selection and with 10 total signatories, 4 of them outside the selection, it adds 40 thousand euros to the total production and 24 thousand euros to the internal one.

Comparison

This option allows you to compare similar groups activity, particularly when one of the following types of ascription is selected:

  • Macroarea
  • Center
  • Research institutes
  • Department

When we chose a selection of these ascriptions (and only one) a comparison between all ascriptions of the same type is performed.

For example, if we select only one an institute, a comparison of all institutes is performed.

In the case of selecting a department, the comparison is not performed with everyone else, but only with the same macroarea departments to standardize and simplify the comparison.

Comparison publications and projects

Absolute production (impact and equity, respectively) of each assignment is shown in a bar graph. You can see the standard chosen by the membership, ie production per capita data.

Evolution of publications, projects and membership and IPs

The evolution of commodity production and project funds is shown. In both cases the chart type can be chosen to be displayed.

In the case of publications, we can see the output in terms of impact, in terms of number, or only the publications in the first decile (excellence). In the case of projects, we can see research and transfer ones. In both cases we can see the output as accumulated or annual, and normalized by the number of members of the ascription.

Average number of signatories

It is shown for both publications and projects.

Internal versus external activity

Relations between these activities for publications and projects.

Gender

Percentage of projects’ PI of women and men.

Top 10

Top 10 on granted funds. The funds of a project are assigned fully to its PI.

General recommendations

An alert is launched in the following cases

  • Relative position low on the selection: it warns of a particularly low situation if we compare it with the rest of ascriptions. Lower means that it is in the percentile 20 or below. It is calculated for publications (total impact, number of publications, publications of excellence) and projects (funds and number).
  • High relative position of the selection: similar to the above, but when the activity is equal to or above the percentile 80.
  • Descending activity: it warns about a consecutive drop in activity during the last full years. Warnings are given for number of publications, impact, excellence publications, number of projects, and project funds.
  • Ascending activity: It warns about a consecutive rise in activity during the last two years, for the activities of the previous section.
  • Mismatch of internal and total output: It is notified when the percentage of internal activity to the total activity is less than 10% , or greater than 90% . It applies to the number of publications and number of projects.
  • Absence of representatives in Top10: Absence in the top 10 of the institution of members of the selection.
Position inside the institution

As a base we have the institution’s researchers heat map, using projects’ production and betweenness. From this map, all members from the selection are placed, to see if the distribution is similar or if it has some clear bias.

Transfer

All the transfer projects registered in the institution are analyzed, similarly to the all section.

Community leaders liable for improvement

It indicates whether the activity of the head of the community is less than twice the average of the activity of other members of their community.

It is calculated for the impact of publications and for project funds.

Alerts

Both data integrated in the selection (total publications’ production, for example) and all of its members individually are studied.

For all of them, their temporal evolution is studied, their distribution and position among the mean, communities, etc, and events which are detached from the norm or markers of activity with special behaviour are remarked.

For example it’d warn in case the activity from some section was decreasing in recent years, very isolated researchers or low activity ones, communities without prominent leaders, people that could improve, etc.

List

For the current selection, and for the kind of data that is being analyzed, all the merits are listed.

The list can be downloaded as an editable file.