¿Qué es Kampal Research?
Es una herramienta para el estudio de redes de colaboración basándose en su actividad de investigación y en sus proyectos. El énfasis se pone en las relaciones entre las personas y en las dinámicas de interacción en lugar de en las propiedades individuales.
¿Qué se puede encontrar en Kampal Research?
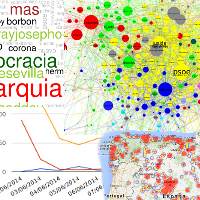
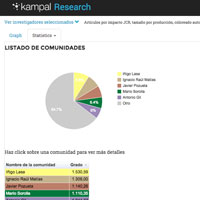
Construimos redes basadas en la interacción de los miembros de una institución, y las representamos a través de mapas con el fin de dar una visión global de cómo se relaciona su personal tanto dentro como fuera de la misma, qué grupos se forman, y cómo evolucionan. También realizamos análisis estadísticos de los datos.

¿Qué datos necesitamos?
Los datos son la parte fundamental del proceso. Principalmente usamos publicaciones científicas y proyectos de investigación. Estos datos pueden ser obtenidos tanto de bases de datos corporativas como públicas.